In the tutorials, some areas in the jABC4 interface will be referenced. This briefly explains these areas and their function.
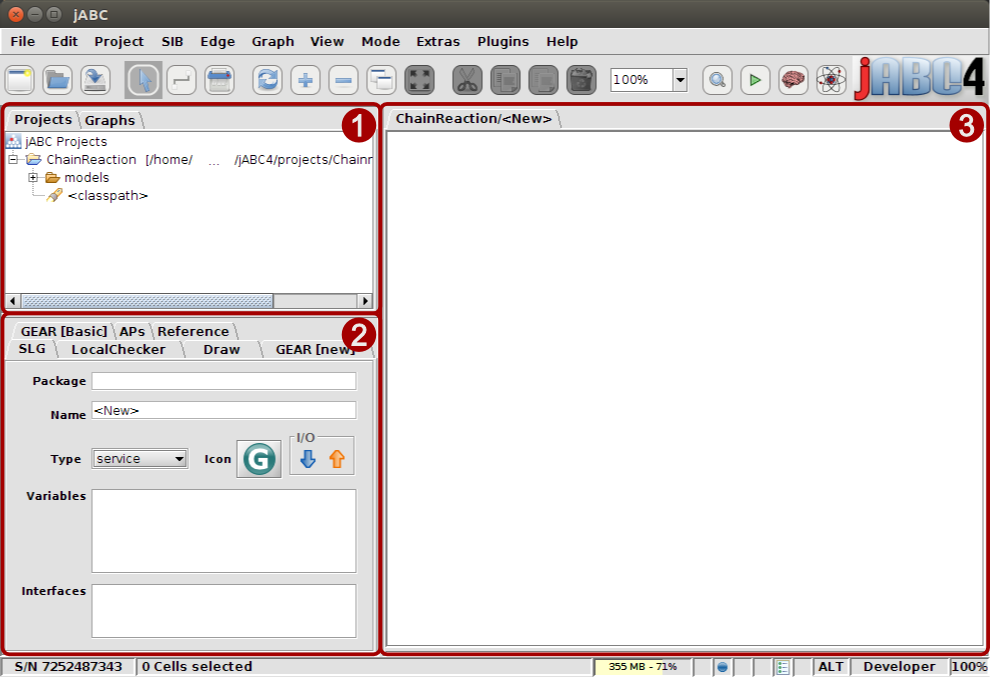
The jABC4 user interface is composed of three main areas:
The Browser Area (1)
This area serves as navigation between your different projects and can contain multiple tabs that are project-specific.
- The Projects tab is always accessible and displays all projects that you created.
- After opening a project, that projects’ Graphs tab is visible, unless the tab is explicitly hidden.
- A project can also have multiple I/O Sib Trees as well as Service Trees, which hold different types of activities usable during modeling.
Projects tab
Here, the list of all projects is shown. When you have more than one project, double-clicking on a project switches into that project making it the active project.
Graphs tab
This tab is only visible for the active project but can also be explicitly hidden for individual projects. The content is composed of the graphs that are accessable in the project, which can be actual model graphs located in the project but also graphs from external libraries.
I/O sib tree
I/O sib trees contain a subset of graphs, which can also be preconfigured to adjust their data flow, documentation.
Service tree
Service trees provide the opportunity to access libraries of source code and use the contained classes and methods to execute them in a graph model.
The Inspector Area (2)
This area holds several tabs associated with the graph model that is currently opened. Most of the time, the SLG tab is the important tab for the process of modeling a graph, since it contains the list of context variables and other data on the graph.
The Graph Canvas (3)
This is the area on which the graph models will be displayed and that makes it possible to add and edit the actions of a graph.